
- technical-analysis-of-stock-trends.html
- technical-analysis-of-stock-trends-part-2.html
- technical-analysis-of-stock-trends-3.html
- technical-analysis-of-stock-trends-4.html
2.7 The Differentiators
It would be worthwhile to explore how the key factors differ in Technical Analysis from Fundamental Analysis. The below table is an attempt to present the key differentiators between these two methods while dealing with the same set of key factors.
|
Key Factors |
Analysis Methods |
|
|
Fundamental Analysis |
Technical Analysis |
|
| Documents considered for data input | Fundamental analysis will have a thorough look at various statements like Income, Cash-flow etc. It also gives utmost importance in scrutinizing the balance sheet too. | Charts which comprise the ‘price trends’ of the stocks are the primary data input. |
| Reasoning behind the analysis | Fundamental analysts believe that the assertion of ‘intrinsic value’ is more important and the same can be ascertained by scrutinizing the financial statements and sheets | Technical analysts believe that the price trend of a stock is the collective indicator of the inherent characteristics. |
| Time frames considered for analysis | Many years of history will be used to ascertain the characteristics. | Data of last few months, weeks or even few hours will be taken in to account to create graph patterns. |
| Benefits of the analysis | Fundamental analysis helps in investment planning and decision making. | Technical analysis is useful for trading. |
2.8 Criticism on Technical Analysis & Counter Arguments by Supporters
There are many experts who criticize the basic tenets of Technical analysis. They severely object the deviation by this analysis from considering the other characteristics of the company which, in fundamental analysis, hold lot of sway.
The campaigners for Fundamental Analysis cite Warren Buffet as the best example for how he used ‘value investing’ strategy adopted by him has repeated billions of dollars. Interestingly this ‘value investing’ is another name given to the Fundamental analysis. In value investing, an investor hunts for a company which is of high quality but is available at cheap price. This ‘cheap price’ can be derived only after doing a complete fundamental analysis of that company. Likewise, fundamental analysts refute the ideology of Technical analysis which considers the short-term data inputs for its analysis.
But the supporters of Technical analysis argue that the amount of data mining that goes into the examination of the stocks invariably includes the so-called ‘character’ of the company too. The supporters are of the belief that the ‘trend chart’ of an asset in itself is the testimony of the company’s behavior. They argue that the price movements recorded in a ‘trend’ would continue to follow the similar trend line in future as well.
Technical analysis believes in ‘market psychology’ i.e. a standard pattern exhibited by the market participants during a given period and thus there are chances for the history to repeat. Based on this assumption, technical analysts prepare charts by recording the patterns and analyze the price movements that will give the complete understanding of the market sentiment.
But the uncontroverted fact is that both the analysis techniques could lead to imperfect derivations. The market analysts use either of these two methods or combine them to arrive at a new model.
2.9 Trend Charts & How to Use Them
It is well known now that Technical Analysis uses ‘Charts’ extensively to determine the possible trading of the stocks. A typical Technical Analysis chart looks something like this:
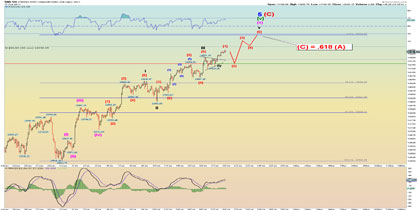
Sample Chart – 1 of Technical Analysis
In this figure one can see how a stock has fared over a period of time with all its high and low peaks. But by drawing a trend-line it can be construed that this particular stock is on the rise steadily. The highs and lows are being recorded against a certain time frame which could be months, weeks or even hours. Thus the X-axis shows the timeline while Y-axis indicates the price range.
Now take a look at this figure:
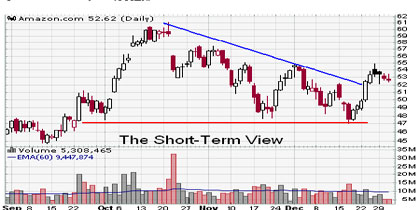
Sample Chart – 2 of Technical Analysis
This particular stock has witnessed a considerable fall from its peak and the trend-line shows that the overall performance of this stock is not that fair and profitable.
These are the visual assertions of the trends but lot goes in deriving the logical conclusions from them. The highs and lows carry more inherent messages and digging into them is what the technical analysts try to do.
2.10 Closer Look at a Trend
A Technical analyst tries to decipher the above graphs in a systematic way by mapping the highs and lows and compares the highs vs. highs and lows vs. lows. For an analyst a healthy trend is the one whose highs are showing an ‘uptrend’ and the lows also are showing an ‘uptrend’.
What does this mean to layman?

Sample Chart -3. The Highs & The Low
Take a look at the above picture and observe the highs and lows. It can be observed that the progressive peaks of the highs of each product are relatively higher than the previous peaks. Similarly the progressive peaks of the lows are consistently higher than the previous peaks. In nutshell, the technical analysis adopted here can be described as ‘greater highs and greater lows’ which are on ascent over a given time frame.
In other words and in much simple fashion it can be understood the trend as ‘the space that shows either upward and downward movements of a stock and if the space is more towards upward the stock is construed as doing well in the market and the larger downward space shows the failure of the same stock.’
2.11 Understanding the Trends
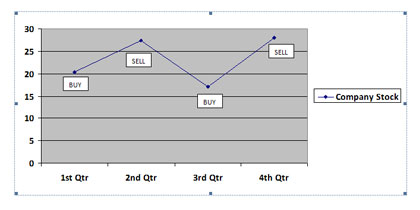
Understanding the Trends
Chart patterns depict the moods and mentalities of the markets. They do not show the whims and fancies of an individual or company’s management but represents the overall behavior of a stock in a given time frame. The trends and trend-lines are the evidences and not myths of performances by the stocks in the market.
The above diagram shows a typical upward and downward trend of a company’s stocks. The zigzags are the indicators of the stocks behavior over a period of 4 quarters and how the investors traded them. It is evident that the investors have bought the stocks when the price pattern hit the low peak and sold them at their high peaks.
Let us assume the above scenario from a different perspective and how the company’s stocks have been traded in the markets.

Understanding Short & Cover Trends
In the above graph an investor has bought (Short peaks) the shares when they were being offered at low prices and sold (Cover peaks) them at later dates when the prices went up. The above technical analysis can hint that the stocks of this company have shown standard behaviors with consistent ups and downs.
Read part 3 here -> technical-analysis-of-stock-trends-3.html