THIS IS IN CONTINUATION OF THE 4TH PART.
- technical-analysis-of-stock-trends.html
- technical-analysis-of-stock-trends-part-2.html
- technical-analysis-of-stock-trends-3.html
- technical-analysis-of-stock-trends-4.html
6.3 Benefits of Charts
Charts are beneficial in many ways as they add clarity, bring out new meanings and present the facts and figures without distortions. It is up to the users on how best they can be utilized.
7.0 Chart Patterns – Types, Meanings and Usages
Having understood the tenets of Technical Analysis, Trends, Charts and their types, we can now move to an advanced topic of understanding the Chart Patterns.
We have seen that every chart displays distinctive placements of the data fields which form themselves into peculiar ‘shape’ and the analysis of these shapes are called as Chart Patterns.
7.1 Types of Chart Patterns
Technical analysts believe that history repeats itself and thereby hints us to predict the future movements of the markets. The study of the chart patterns provides the insight into the history y’ that which repeats over the timeframe and thus leaving the patterns which would tell us the repetitiveness of historical events.
Before venturing into the realms of chart patterns, it must be borne in mind that none of these would give 100% assurance about how the stocks would behave or where they are headed for. That is why the whole Technical Analysis methodology is being criticized as unscientific practice.
Notwithstanding this criticism let us explore the types of chart patterns and how best they could be utilized to understand the market psychology.
Chart patterns are broadly classified in to two types i.e. Continuation and Reversal.
Continuation chart pattern indicates that the present price trend may continue till the end of the pattern while Reversal pattern denotes a previous trend would reverse on completion of the pattern.
Each of the above patterns has sub-categories and the list is here under:
|
Continuation Pattern
|
Reversal Pattern
|
| Cup with Handle | Heads & Shoulders |
| Flag & Pennant | Double Tops & Bottoms |
| Triangles | Triple Tops & Bottoms |
| Rounding Bottom | |
| Wedges |
Firstly let us understand the Continuation patterns.
- Cup & Handle
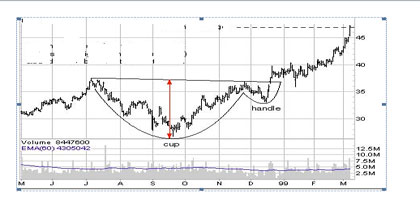
Sample of Cup & Handle chart pattern
In the above picture we can see a Cup shape of the trend line followed by a Handle like pattern and that is why this chart pattern is named as Cup with Handle by William O’Neil in his book ‘How to Make Money in Stocks’ published in 1988.
This chart pattern represents a bearish trend i.e. downslide of security’s price and is generally prepared by taking long-term data into account. In this pattern we can see that the price of the security has started declining after a successful upward movement and touched its Support level and later started gaining the upward surge and hit the Resistance level. Thereafter, it started to slide below the resistance level and after certain period gained the momentum to rise. In financial terms this is called as a period of consolidation followed by a breakout.
- Flag & Pennant
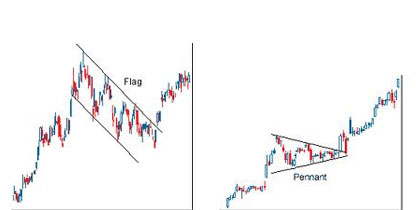
Sample of Flag & Pennant chart pattern
These are two short term patterns which depict a movement in the pricing with sharp rise or decline and will be generally succeeded by Sideways movement of price. In these patterns there will be small consolidation before the older movement continues.
The main difference between the Flag and Pennant is the characterization of the trend line. In Pennant pattern the trend line would look converging whereas in Flag pattern they shows the pattern of a channel.
- Triangles
Triangles are the popular chat patterns and there are 3 types of them
(A) Symmetrical;
(B) Ascending; and
(C) Descending.
These patterns can include any kind of timeframe i.e. from few weeks to several months.
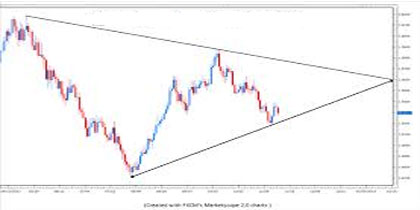
Symmetrical triangle
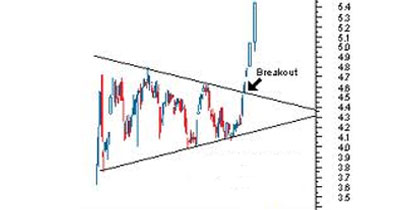
In symmetrical triangle, the trend lines convert after witnessing at least two lower highs or higher lows.
Ascending triangle
Ascending triangle displays a bullish tendency when the security price is on rise and shows the accumulation of the security.
Descending triangle
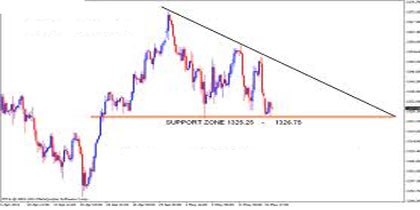
Descending triangle shows the signs of bearish run in which the security’s price sees a continuous downward trend and hints the distribution of the security.
With this we have concluded the Continuation patterns and let us look into the Reversal patterns.
- Head & Shoulders
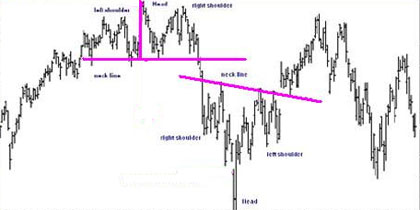
This is the highly popular pattern with many technical analysts and is a reversal chart pattern. In Head and Shoulders pattern, one high peak would be preceded and succeeded by two lower peaks and these two lower peaks could be asymmetrical and equal to each other. There are two variants of this pattern named as Head & Shoulders Top (Fig 1) and Head & Shoulders Bottom (Fig 2). Both these variants depict the weakening of a security in which its deterioration is shown in successive highs and lows.
- Double Tops & Bottoms
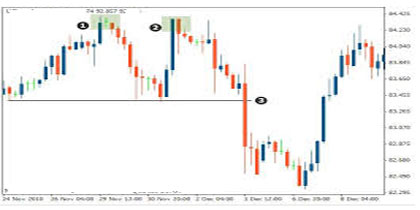
Double Top & Bottom pattern is another popular pattern used by many analysts and investors. Majority of the users consider this pattern as a reliable one. In the Top trend two peaks and in Bottoms pattern two lows can be seen.
In a Double Top pattern the price tries to rise to Top 1 but plugs to lower price and again pushes itself up to form Top 2. Thereafter it fails to sustain the position and continues to reveal its reversal pattern.
In Double Bottoms, price trend creates two successive lowest peaks but finds the support on each occasion and thereafter rises slowly.
- Triple Tops & Bottoms
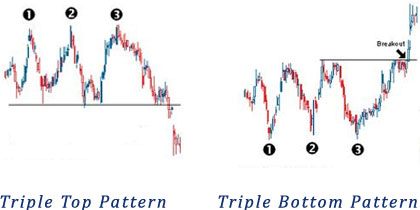
These reversal pattern chart types that are less prevalent amongst the analyst community but these too operate in line with other types like Head & Shoulders or Double Top & Bottoms.
The one puzzlement that a user can face while using these patters is in understanding and identifying the formation of the triple tops and bottoms as both look similar.
A typical Triple Top pattern represents the bearish trend wherein three equal upward peaks can be found with downslide that goes below the Support level (Refer Fig.1).
A Triple Bottom pattern is a bullish trend where three successive lows can be seen with a steady but steep rise in the price which shows breakout above the Resistance value.
- Rounding Bottom
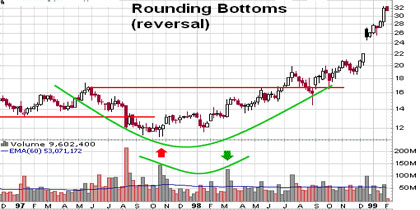
This pattern is also called ‘saucer pattern’ as the trend lines form a saucer shape on the graph. This pattern represents a prolonged period of consolidation during which a bearish trends turns in to bullish. This pattern, at times looks like a Head & Shoulders but without conspicuous shoulders. Some analysts feel that the saucer pattern is somewhat closer to the Cup with Handle patter but without the handle and thus lacking the edge to arrive at a conclusion.
- Wedges
There are two types of wedges i.e. (i) Falling wedge and (ii) Rising wedge.
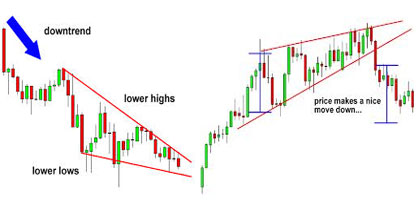
Falling Wedge Rising Wedge
This is a mixed patter i.e. it can either represent a Continuation or a Reversal pattern and almost looks similar to Symmetrical Triangle pattern with a subtle difference wherein the pattern shows inclinations in upward or downward directions. You can recollect that in Symmetrical Triangle there is a tendency to exhibit Sideways pattern.
Falling Wedge represents bullish trend and the rising one represents bearish movement in which the trading range would get narrowed as the price goes up.
7.2 Conclusion of Chart Patterns
With this we have concluded the Chart Patterns wherein 9 patterns were discussed in details and with samples charts.
Let us move to another important topic called ‘Moving Averages’.
8.0 Moving Averages
More often than not many users of the charts of technical analysis would get confused as these charts and chart patterns display the price movement with huge variations. Moving Averages, the most popular trend indicator, helps the traders to overcome this confusion as this average represents the average price of a stock over a stipulated period of time thus enabling the traders to determine the price trend with more clarity.
There are 3 types of Moving Averages and they are:
- Simple Moving Averages (SMA)
- Linear Weighted Average (LWA)
- Exponential Moving Average (EMA)
Simple Moving Averages (SMA)
As the name itself indicates this is the simplest method of calculating the average price by adding up all the closing prices of a stock during a particular time period and dividing the result with the time period. For example, on a time frame of 30 days, the closing price of the stock on each day (1st to 30th day) would be added and the sum would be divided by 30 to achieve the SMA.
Linear Weighted Average (LWA)
In this method, the sum of all the closing prices during a particular period would be multiplied by the position of data points and this resultant would be further divided by the sum of the number days. This is the less prevalent method and is being used while facing problems with equal weighting.
Exponential Moving Average (EMA)
This method is being considered as the efficient method in which much weight would be given to the latest data point.
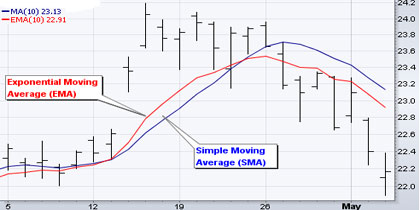
In the above chart you can see both SMA and EMA wherein the EMA is seen falling faster than SMA. This is because EMA is highly responsive to the latest data as compared to SMA.
8.1 Benefits of Moving Averages
Moving Averages help the analysts and traders to benchmark many crucial parameters like latest trends, support and resistance levels. They offer a quick glance at the performance of a particular stock in determining its upward and/or downward trends.
9.0 Indicators & Oscillators
This section throws light on the crucial and deeper topics called Indicators and Oscillators.
Indicators are the things which are the calculators that comprise of information like cash flow, trends, momentum and volatility of any given security/stock. These calculations will be done based on the price and volume of the given security/stock. These indicators are of two types i.e. (1) Leading and (ii) Lagging.
Leading indicator is a predictive mechanism as it precedes the movements of prices whereas Lagging indicator is a confirmation mechanism as it follows the price movement.
Indicator construction can be done in two ways i.e. those which fall in a bounded range and those which do not. The things which are bound in a range are called as Oscillators and these are the most prevalent ones. An Oscillator indicates the fluctuations of a price between two set levels or over and below a central line drawn over a chart.
10.0 Conclusion
This article is a brief introduction to the stock market, its operations and more importantly about Technical Analysis which is an important analytical tool used by many market analysts and investors.
All major aspects of Technical Analysis have been covered with illustrations so that the readers can get to the gist of the conceptual basis.